

This post is a case study of an issue I faced in the form of a stuck Ruby micro-service. The Rails server would boot up and service requests for a while until it would stop responding.
The next problem was verification. How can we tell that the process is stuck? What are the conditions that contribute to it?
To verify that the process is indeed, stuck!
The primary characteristic of a stuck process is that it stops responding to interrupts, save the kill signal. Puma server has a well documented and robust interrupt behavior.
Lets send USR1 signal to the process to see what is the default behavior of Puma.
# IN TERMINAL A

master ● bundle exec rails s
=> Booting Puma
=> Rails 6.0.2.2 application starting in development
=> Run `rails server --help` for more startup options
Puma starting in single mode...
* Version 4.3.3 (ruby 2.7.0-p0), codename: Mysterious Traveller
* Min threads: 5, max threads: 5
* Environment: development
* Listening on tcp://127.0.0.1:3000
* Listening on tcp://[::1]:3000
Use Ctrl-C to stop

# IN TERMINAL B

● lsof -i tcp:3000 | tail -1 | cut -d' ' -f 5
92187
● sudo kill -USR1 92187

# BACK IN TERMINAL A

...
* phased-restart called but not available, restarting normally.
* Restarting...
=> Booting Puma
=> Rails 6.0.2.2 application starting in development
=> Run `rails server --help` for more startup options
Puma starting in single mode...
* Version 4.3.3 (ruby 2.7.0-p0), codename: Mysterious Traveller
* Min threads: 5, max threads: 5
* Environment: development
* Listening on tcp://127.0.0.1:3000
* Listening on tcp://[::1]:3000
Use Ctrl-C to stop
I found that the microservice didn’t exhibit the above behaviour after sending a restart signal.
To find the steps that lead to a stuck process.
dtrace via dtruss
I have had much success with strace to identify the cause of a similar problem, in the past. I tried installing it on my Mac laptop and found that strace is only available on linux but, there is an alternative, dtrace via dtruss.
sudo dtruss -p <PID>The above command starts a firehose of logs ( especially if the process is active ) which gives an idea the type of system calls made by the process monitored by dtruss. Unlike strace, dtrace didn't seem to slow down the process it was attached to.
This proved to be a dead end as I was not able to figure-out a pattern and decided to look for alternatives. While I was reading up on dtrace, I came across Behind the scenes of shell IO redirection by René Hansen. This post gives a fair idea of how to use the tool and it also includes suggested reading.
rbtrace
I came across this tweet from Sam Saffron on using rbtrace for debugging stuck process and decided to give rbtrace a try. Originally written by Aman Gupta, who is the author of libraries such as EventMachine, rbtrace describes itself as, like strace, but for Ruby code.
rbtrace has a very robust interface which allows for fine grained control over the desired output format. I started with the full verbose tracing.
# application.rb
require 'rbtrace'

# TERMINAL A
bundle exec rails s

# TERMINAL B
rbtrace -p 87854 --firehose
Since the micro-service had many threads and did many things in the background, rbtrace's verbosity was simply, like in the case of dtrace, quite overwhelming.
I still didn't know what I was looking for, which made the whole task akin to looking for a needle in a haystack. To give an idea of the haystack's size, for a freshly created Rails application, visiting localhost:3000 resulted over 94,000 lines of rbtrace-logs.
I also found that rbtrace was only usable as long as the primary Ruby process was responsive. Once the main process gets stuck, rbtrace stopped sending any messages, or the client refused to 'attach' to the process. This proved not useful, mostly when I ran the script shared in the tweet above.
P.S
In hindsight, I feel I didn't spent much time with rbtrace, as much as I did with dtruss. rbtrace is an excellent tool and if I had given enough time, I could have found the root cause without using lldb.
Inspecting a process with lldb.
I needed a tool that could show me the exact state of the process and threads after it is stuck, which led me to gdb and eventually to lldb.
Apparently, MacOs dropped support for gdb, and since 2005 Mac has been steadily moving away from the GNU toolchain. I decided to give lldb a go. lldb gets installed whenever Xcode Tools or Xcode is installed.
NOTE:
All lldb stacktraces are read bottom-up, hence frame #1 is chronologically after frame #2.
Running lldb on the stuck Ruby process,
master ● sudo lldb -p 20722
(lldb) process attach --pid 20722
Process 20722 stopped
* thread #1, queue = 'com.apple.main-thread', stop reason = signal SIGSTOP
    frame #0: 0x00007fff7279f882 libsystem_kernel.dylib`__psynch_cvwait + 10
libsystem_kernel.dylib`__psynch_cvwait:
->  0x7fff7279f882 <+10>: jae    0x7fff7279f88c            ; <+20>
    0x7fff7279f884 <+12>: movq   %rax, %rdi
    0x7fff7279f887 <+15>: jmp    0x7fff7279d629            ; cerror_nocancel
    0x7fff7279f88c <+20>: retq
Target 0: (ruby) stopped.

Executable module set to "/Users/<user>/.rbenv/versions/2.5.1/bin/ruby".
Architecture set to: x86_64h-apple-macosx-.
(lldb)
Don't worry with all that stuff that is in that log/code snippet. It didn't make sense to me either. What we are interested, are in the threads. What are the threads doing?
I could see the list of all running threads using thread list command.
(lldb) thread list
Process 20722 stopped
* thread #1: tid = 0x8f037, 0x00007fff7279f882 libsystem_kernel.dylib`__psynch_cvwait + 10, queue = 'com.apple.main-thread', stop reason = signal SIGSTOP
  thread #2: tid = 0x8f039, 0x00007fff727a33d6 libsystem_kernel.dylib`poll + 10, name = 'ruby-timer-thr'
  thread #3: tid = 0x8f04a, 0x00007fff7279f882 libsystem_kernel.dylib`__psynch_cvwait + 10, name = 'ruby_thread_lo*'
  thread #4: tid = 0x8f088, 0x00007fff7279f882 libsystem_kernel.dylib`__psynch_cvwait + 10, name = 'connection_poo*'
  thread #5: tid = 0x8f0bf, 0x00007fff727a50fe libsystem_kernel.dylib`__select + 10, name = 'thread_pool.rb*'
  thread #6: tid = 0x8f0c0, 0x00007fff7279f882 libsystem_kernel.dylib`__psynch_cvwait + 10, name = 'thread_pool.rb*'

 ...
I needed a way to find out what these threads are currently doing. thread backtrace all provides backtraces of all the threads that are running.
(lldb) thread backtrace all
* thread #1, queue = 'com.apple.main-thread', stop reason = signal SIGSTOP
  * frame #0: 0x00007fff7279f882 libsystem_kernel.dylib`__psynch_cvwait + 10
    frame #1: 0x00007fff72860425 libsystem_pthread.dylib`_pthread_cond_wait + 698
    frame #2: 0x00000001070714b3 libruby.2.5.dylib`gvl_acquire_common + 179
    frame #3: 0x0000000107068b13 libruby.2.5.dylib`native_sleep + 435
    ...
    frame #26: 0x00007fff7265bcc9 libdyld.dylib`start + 1

  thread #2, name = 'ruby-timer-thr'
    frame #0: 0x00007fff727a33d6 libsystem_kernel.dylib`poll + 10
    frame #1: 0x00000001052236d1 libruby.2.5.dylib`thread_timer + 417
    frame #2: 0x00007fff72860109 libsystem_pthread.dylib`_pthread_start + 148
    frame #3: 0x00007fff7285bb8b libsystem_pthread.dylib`thread_start + 15

  thread #3, name = 'ruby_thread_lo*'
    frame #0: 0x00007fff7279f882 libsystem_kernel.dylib`__psynch_cvwait + 10
    frame #1: 0x00007fff72860425 libsystem_pthread.dylib`_pthread_cond_wait + 698
    frame #2: 0x000000010521abaa libruby.2.5.dylib`native_sleep + 586
    frame #3: 0x0000000105225746 libruby.2.5.dylib`queue_sleep + 118
...
Let's look at the backtrace of one specific thread, say the first one, and see try to figureout what it is doing.
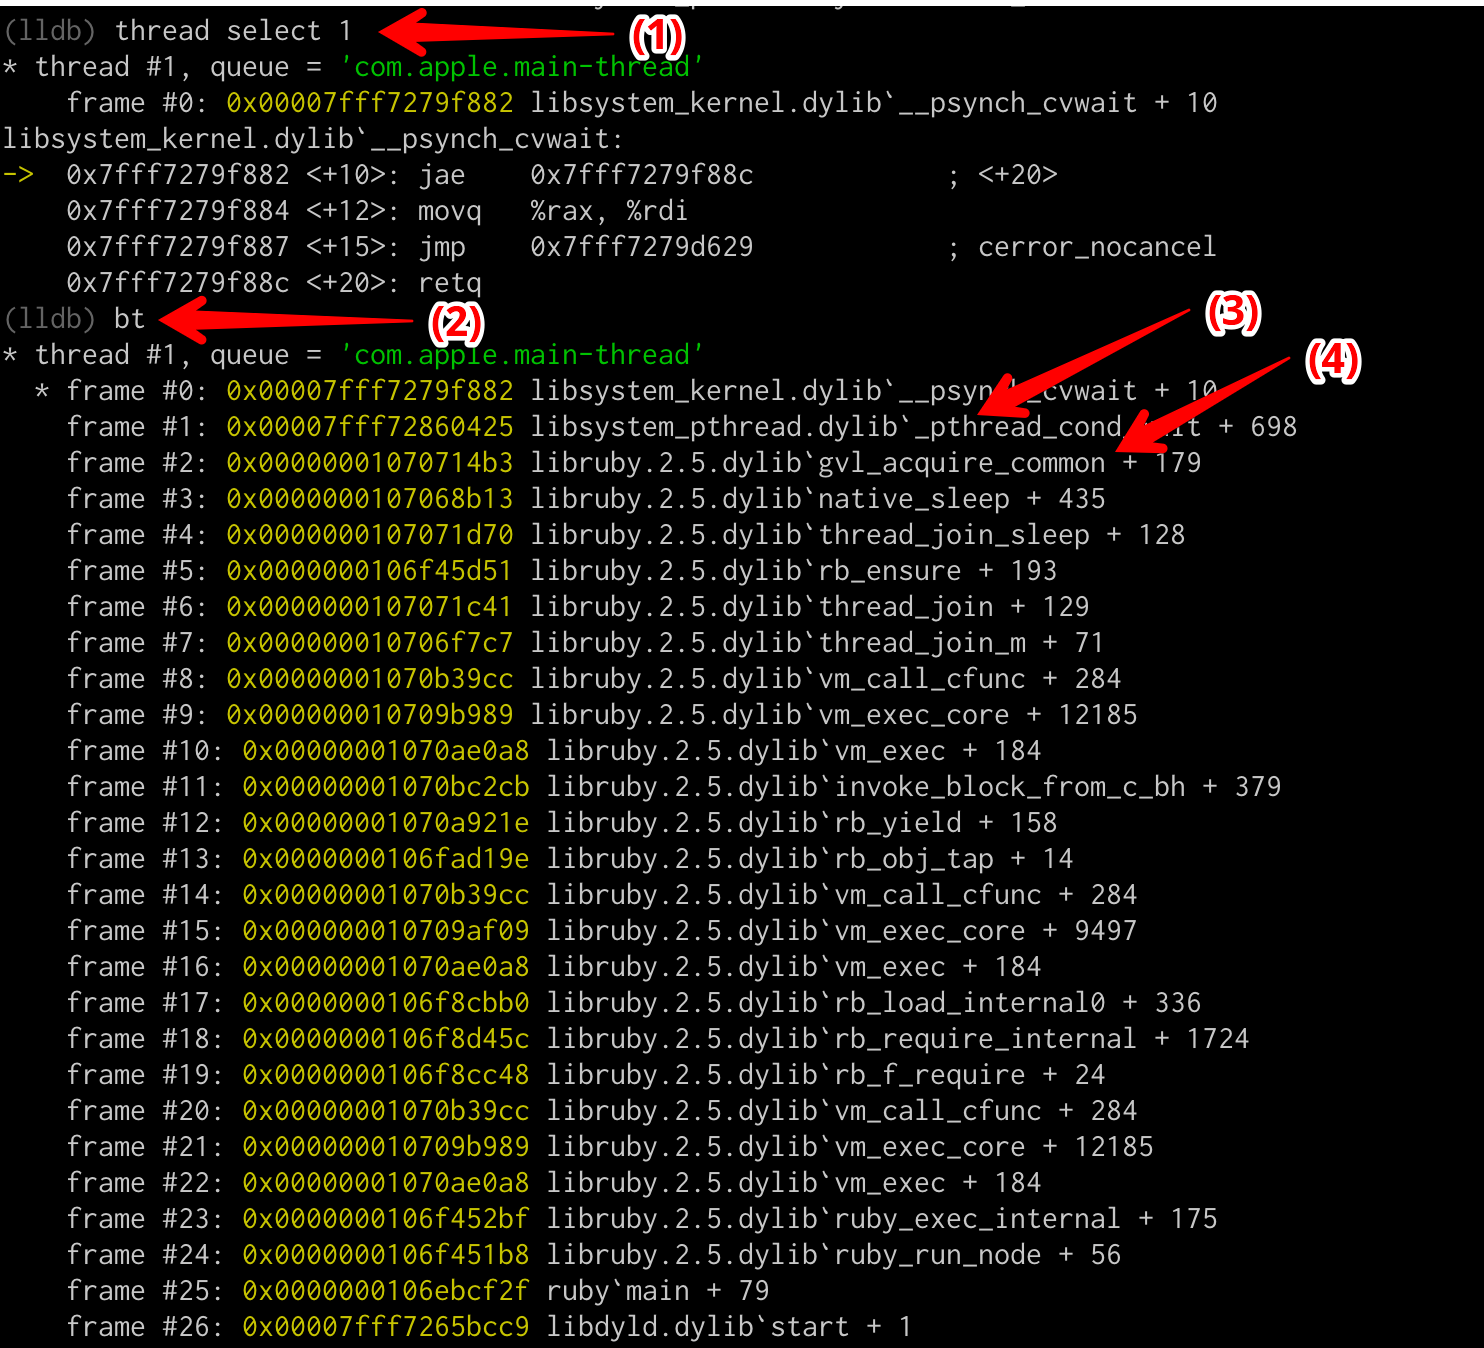
(1) command to select the first thread
(2) Shortcut bt for backtrace, shows the full backtrace of the thread.
(3) _pthread_cond_wait comes from pthread.h file of the underlying C implementation of Ruby. This function is used to conditionally wait until a mutex is released.
(4) gvl_acquire_common Thread is currently trying to acquire GVL as any Ruby thread that wishes to execute should acquire the GVL.
To summarize, this particular thread is trying to acquire GVL, but is conditionally waiting for a mutex to be released.
This is part of how threads are scheduled within the Ruby runtime, but in our case a majority of these threads were stuck with gvl_acquire_common, which was not normal.
The curious ones.
Now that these threads are stuck waiting to acquire the Global Interpreter Lock, we need to find out what is causing them to wait. The best way to figure that out is to look for threads with unusual backtraces that stand-out from the rest.
Following are the list of the crazy ones, the misfits, the rebels, the troublemakers out of a total of 67 threads.
thread #2, name = 'ruby-timer-thr'
The timer thread is part of thread-scheduling mechanism of Ruby language. It is a native thread and can be safely ignored from our list of suspects.
thread #2, name = 'ruby-timer-thr'
    frame #0: 0x00007fff727a33d6 libsystem_kernel.dylib`poll + 10
    frame #1: 0x0000000107071763 libruby.2.5.dylib`thread_timer + 563
    frame #2: 0x00007fff72860109 libsystem_pthread.dylib`_pthread_start + 148
    frame #3: 0x00007fff7285bb8b libsystem_pthread.dylib`thread_start + 15
thread #6, name = 'utils.rb:193'
If we read from frame #7 to #3 of the following backtrace, we can see that this thread is trying to get a lock on something called a v8::Isolate. On further reading, it looks like a v8::Isolate is an isolated instance of V8 engine, the Javascript interpreter that powers Chrome and Node.js.
thread #6, name = 'utils.rb:193'
    frame #0: 0x00007fff7279f062 libsystem_kernel.dylib`__psynch_mutexwait + 10
    frame #1: 0x00007fff7285d917 libsystem_pthread.dylib`_pthread_mutex_firstfit_lock_wait + 83
    frame #2: 0x00007fff7285b937 libsystem_pthread.dylib`_pthread_mutex_firstfit_lock_slow + 222
    frame #3: 0x0000000107c3d376 libv8.dylib`v8::Locker::Locker(v8::Isolate*) + 94
    frame #4: 0x0000000107a54976 init.bundle`rr::Locker::doLock(int, unsigned long*, unsigned long) [inlined] rr::Locker::setupLockAndCall(state=0x0000700003b9083c, code=140299575081440) at locker.cc:47:17
    frame #5: 0x0000000107a5496f init.bundle`rr::Locker::doLock(argc=<unavailable>, argv=0x00007f9a70448470, self=<unavailable>) at locker.cc:39
    frame #6: 0x00000001070b39cc libruby.2.5.dylib`vm_call_cfunc + 284
    frame #7: 0x000000010709af09 libruby.2.5.dylib`vm_exec_core + 9497
    ...
thread #8, name = 'utils.rb:193'
I also found few other threads with similar backtraces, the ones with rb_thread_io_blocking_region (in frame #1) call. Reading up the backtrace from frame #6 upto #0, it looks like this thread is doing a IO operation. We also know that a Ruby thread doesn't need GVL for performing IO and hence this thread can be safely eliminated from our list of possible suspects.
thread #8, name = 'utils.rb:193'
    frame #0: 0x00007fff7279d81e libsystem_kernel.dylib`read + 10
    frame #1: 0x000000010706a769 libruby.2.5.dylib`rb_thread_io_blocking_region + 265
    frame #2: 0x0000000106f6d12d libruby.2.5.dylib`io_fillbuf + 157
    frame #3: 0x0000000106f6daba libruby.2.5.dylib`rb_io_getline_0 + 1162
    frame #4: 0x0000000106f83ee1 libruby.2.5.dylib`rb_io_getline + 113
    frame #5: 0x0000000106f7874b libruby.2.5.dylib`rb_io_gets_m + 11
    frame #6: 0x00000001070b39cc libruby.2.5.dylib`vm_call_cfunc + 284
...thread #21, name = 'base.rb:118'
The following thread, Thread 21 is an example of a thread that is waiting to be scheduled by the Ruby vm. As it is not doing anything, we can remove this one as well from our list.
thread #21, name = 'base.rb:118'
    frame #0: 0x00007fff7279f882 libsystem_kernel.dylib`__psynch_cvwait + 10
    frame #1: 0x00007fff72860425 libsystem_pthread.dylib`_pthread_cond_wait + 698
    frame #2: 0x0000000107068baa libruby.2.5.dylib`native_sleep + 586
    frame #3: 0x0000000107073746 libruby.2.5.dylib`queue_sleep + 118
    frame #4: 0x0000000106f45d51 libruby.2.5.dylib`rb_ensure + 193
    ...
thread #41, name = 'utils.rb:193'
This thread is doing a lot. On frame #32, it is starting a foreign function written in C via vm_call_cfunc. Throughout the backtrace, we can see namespacing of the form rr::. This is a namespace created by therubyracer gem. ( therubyracer gem is used to evaluate Javascript strings from Ruby)
- Frames #32 through #30 locks the V8::Isolate. This section is very similar to the backtrace of thread #6.
- Frames #29 through #21 the sets-up a v8::Handle. From v8's documentation, here we are creating what is called a Transient Handle (There are two types of Handles, Transient and Permanent ), which is used by V8's GC to keep track of objects created, within current scope.
- Frames #28 through #12 registers an external exception handler with the v8::Isolate.
- Frames #11 through #10 executes the javascript string.
- Frames #9 through #0 tries to capture that result and get it back into the calling user-land Ruby thread, but as we can see, on frame #2, it gets stuck on gvl_acquire_common.
thread #41, name = 'utils.rb:193'
    frame #0: 0x00007fff7279f882 libsystem_kernel.dylib`__psynch_cvwait + 10
    frame #1: 0x00007fff72860425 libsystem_pthread.dylib`_pthread_cond_wait + 698
    frame #2: 0x00000001070714b3 libruby.2.5.dylib`gvl_acquire_common + 179
    frame #3: 0x000000010706a482 libruby.2.5.dylib`rb_thread_schedule_limits + 386
    frame #4: 0x000000010706b3a2 libruby.2.5.dylib`rb_threadptr_execute_interrupts + 1474
    frame #5: 0x000000010709c7b9 libruby.2.5.dylib`vm_exec_core + 15817
    frame #6: 0x00000001070ae0a8 libruby.2.5.dylib`vm_exec + 184
    frame #7: 0x00000001070acb56 libruby.2.5.dylib`vm_invoke_proc + 374
    frame #8: 0x00000001070bb384 libruby.2.5.dylib`vm_call0_body + 1236
    frame #9: 0x00000001070a6145 libruby.2.5.dylib`rb_funcallv + 245
    frame #10: 0x0000000107a5b562 init.bundle`rr::TryCatch::doCall(code=140299574741160) at trycatch.cc:85:12
    frame #11: 0x0000000106f45bff libruby.2.5.dylib`rb_protect + 335
    frame #12: 0x0000000107a5b4a6 init.bundle`rr::TryCatch::setupAndCall(state=0x0000700003c937dc, code=140299574741160) at trycatch.cc:79:20
    frame #13: 0x0000000107a5b394 init.bundle`rr::TryCatch::doTryCatch(argc=0, argv=0x00007f9a503604a8, self=<unavailable>) at trycatch.cc:69:20
    frame #14: 0x00000001070b39cc libruby.2.5.dylib`vm_call_cfunc + 284
    frame #15: 0x000000010709af09 libruby.2.5.dylib`vm_exec_core + 9497
    frame #16: 0x00000001070ae0a8 libruby.2.5.dylib`vm_exec + 184
    frame #17: 0x00000001070acb56 libruby.2.5.dylib`vm_invoke_proc + 374
    frame #18: 0x00000001070bb384 libruby.2.5.dylib`vm_call0_body + 1236
    frame #19: 0x00000001070a6145 libruby.2.5.dylib`rb_funcallv + 245
    frame #20: 0x0000000106f45bff libruby.2.5.dylib`rb_protect + 335
    frame #21: 0x0000000107a53c07 init.bundle`rr::Handles::HandleScope(int, unsigned long*, unsigned long) [inlined] rr::Handles::SetupAndCall(state=0x0000700003c941fc, code=140299574741440) at handles.cc:27:10
    frame #22: 0x0000000107a53bef init.bundle`rr::Handles::HandleScope(argc=<unavailable>, argv=0x00007f9a503603c0, self=<unavailable>) at handles.cc:18
    frame #23: 0x00000001070b39cc libruby.2.5.dylib`vm_call_cfunc + 284
    frame #24: 0x000000010709af09 libruby.2.5.dylib`vm_exec_core + 9497
    frame #25: 0x00000001070ae0a8 libruby.2.5.dylib`vm_exec + 184
    frame #26: 0x00000001070acb56 libruby.2.5.dylib`vm_invoke_proc + 374
    frame #27: 0x00000001070bb384 libruby.2.5.dylib`vm_call0_body + 1236
    frame #28: 0x00000001070a6145 libruby.2.5.dylib`rb_funcallv + 245
    frame #29: 0x0000000106f45bff libruby.2.5.dylib`rb_protect + 335
    frame #30: 0x0000000107a54989 init.bundle`rr::Locker::doLock(int, unsigned long*, unsigned long) [inlined] rr::Locker::setupLockAndCall(state=0x0000700003c94c0c, code=140299574741520) at locker.cc:48:13
    frame #31: 0x0000000107a5496f init.bundle`rr::Locker::doLock(argc=<unavailable>, argv=0x00007f9a50360388, self=<unavailable>) at locker.cc:39
    frame #32: 0x00000001070b39cc libruby.2.5.dylib`vm_call_cfunc + 284
    ...
thread #67, name = 'SamplerThread'
This thread is started along with the v8::Isolate. Its primary job is to periodically sample the state of the VM and optionally, (if used for profiling) the program counter and stack pointer for, the thread that created it.
thread #67, name = 'SamplerThread'
    frame #0: 0x00007fff7279ce36 libsystem_kernel.dylib`semaphore_wait_trap + 10
    frame #1: 0x0000000107c9f053 libv8.dylib`v8::internal::MacOSSemaphore::Wait() + 17
    frame #2: 0x0000000107be2be0 libv8.dylib`v8::internal::RuntimeProfiler::WaitForSomeIsolateToEnterJS() + 70
    frame #3: 0x0000000107c9f1c0 libv8.dylib`v8::internal::SamplerThread::Run() + 34
    frame #4: 0x0000000107c9eb1f libv8.dylib`v8::internal::ThreadEntry(void*) + 60
...We have removed all threads except thread #6 and thread #41 from our list of suspects. It is time for us to look at both of them together.
thread #6, a user-land Ruby thread is holding the GVL and is trying to lock the v8::Isolate through the ffi given by therubyracer.
thread #41, a native thread is holding the v8::Isolate lock and is trying to acquire GVL.
In short, we have a deadlock.
Conclusion
Once I identified the cause of this deadlock, which is therubyracer gem being not thread safe, it was time to look for its usage within our application. I found that we were using Handlebars.rb gem to render customizable templates, and Handlebars had therubyracer as one of it dependencies.
Solutions were either to add a global mutex which would allow only one thread to enter Handlebar's context or to move away from HandleBars to something like Liquid templating by Shopify. In the end decided to move to Liquid.
References
- V8 Docs by nodesource.com
- The Ruby Racer gem source code
- lldb tutorial and documentation by llvm.org
- Correct way to use a v8::Isolate, StackOverflow
Suggested Reading